
Cyclistic Analysis, Case Study
Advertisment and marketing strategy Analysis
Posted by Diego Rodriguez on August 18th, 2021

Introduction
In this case study provided by the Data Analysis program developed by Google. My role as a junior data analyst is to help Cyclistic, the company I work for, make better business decisions based on my analysis.
In this scenario, the CEO of Cyclistic believes that the future of the company depends on increasing the number of annual members. Therefore, me and my team need to understand how annual members and casual riders use our bicycles. From these insights, we hope to come up with marketing strategies that will increase the number of annual members.
My main task is to analyse Cyclistic datasets to identify how annual and casual members ride, and how their riding patterns defer. On the other hand, our time frame for this analysis is the last twelve months. These results will help my team create a marketing strategy that would increase the number of annual members.
Data Description
I decided to use the R coding language in Rstudio to perform my analysis. Because, it would be easier to manage, given that the datasets were quite large. The data was spread across different datasets with inconsistent naming conventions. This prompted me to choose the naming conventions used in the first quarter of 2020, because it was the latest method used by the company.
Click here to get the original datasets.
Data Cleaning Process
After thoroughly examining my datasets, and establishing proper naming convection. The next step is cleaning and ensuring the integrity of my data
Click here to open a new tab showing my cleaning process using R.
Analysis & Data Visualization
Number of rides taken by casual and members throughout the year
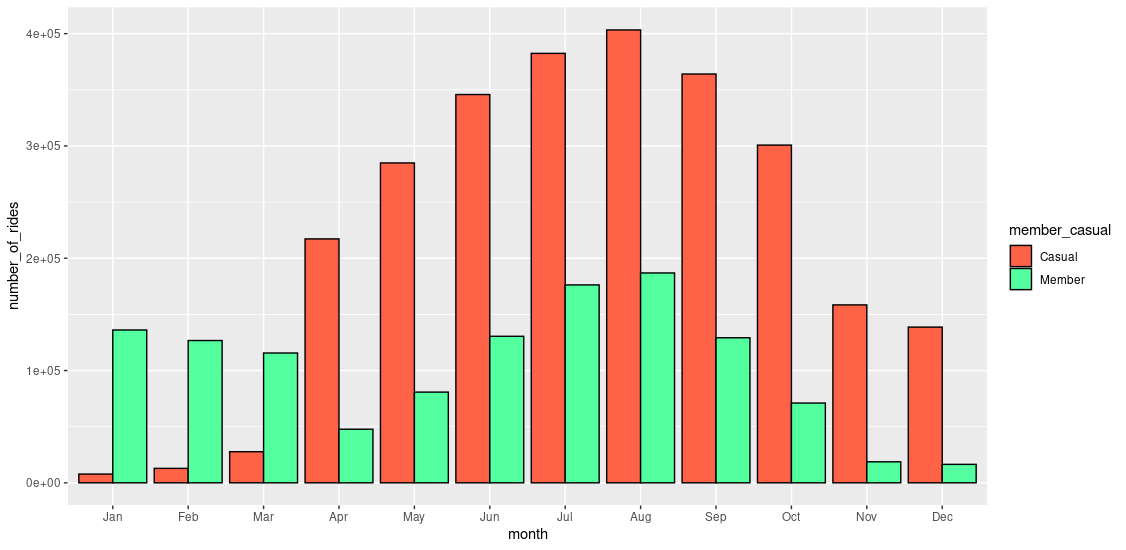
-When compared, casuals and annual member’s number of rides both seem to increase from early Spring to mid Fall. Reaching their highest number of rides in August.
-Based on the number of rides taken by casual and members throughout the year. Casual riders activity increases from March to December.
Number of rides taken by casual and members during weekdays
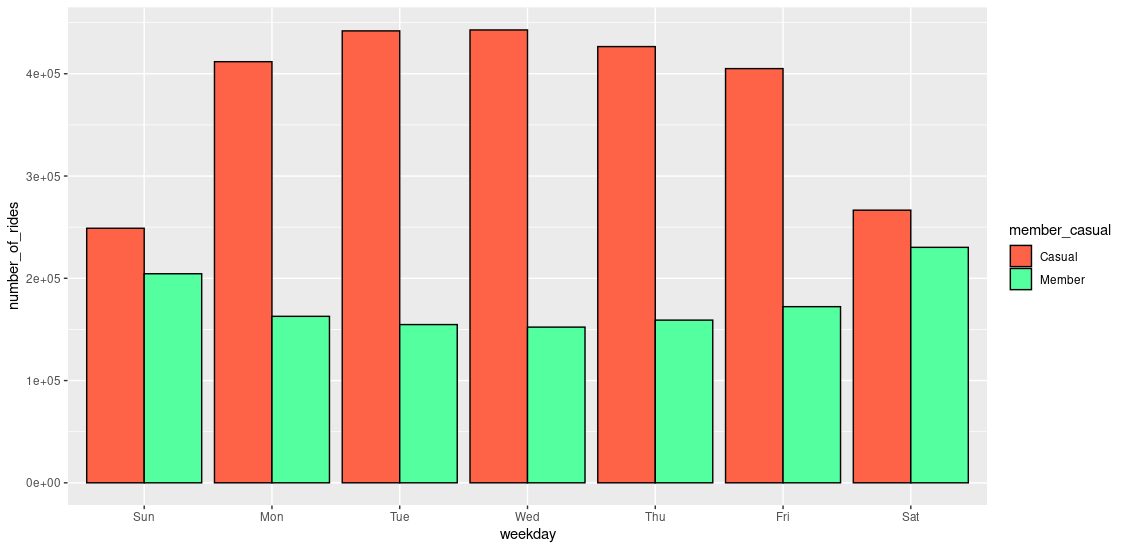
-Throughout weekdays, casual and annual members maintain a relatively constant number of rides per day. Meanwhile, during weekends.
-Casual riders are more active during business days.
Average duration by week day
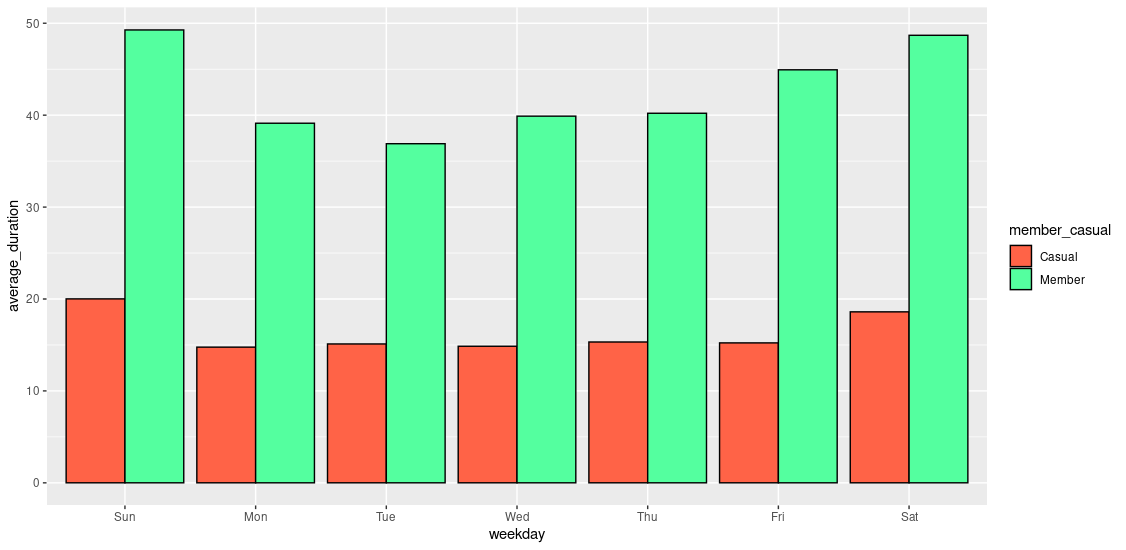
-Throughout weekdays, annual members average duration surpasses casual members by a large margin. And reaches its highest value during the weekends.
-Member's average duration reach its peak during weekends.
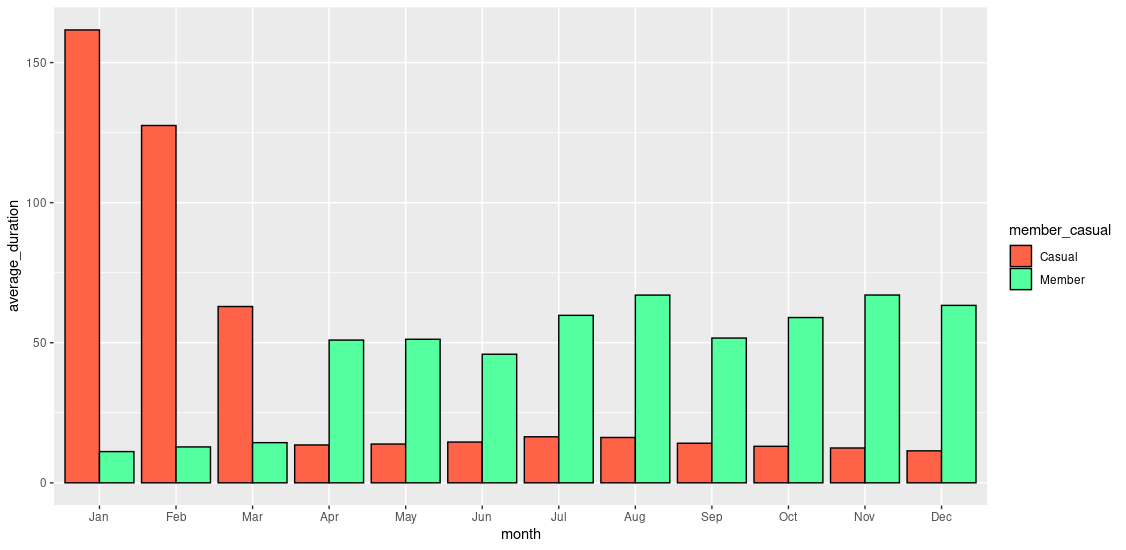
Average duration throughout the year